• NEW! LOWEST RATES EVER -- SUPPORT THE SHOW AND ENJOY THE VERY BEST PREMIUM PARACAST EXPERIENCE! Welcome to The Paracast+, eight years young! For a low subscription fee, you can download the ad-free version of The Paracast and the exclusive, member-only, After The Paracast bonus podcast, featuring color commentary, exclusive interviews, the continuation of interviews that began on the main episode of The Paracast. We also offer lifetime memberships! Flash! Take advantage of our lowest rates ever! Act now! It's easier than ever to susbcribe! You can sign up right here!

    Subscribe to The Paracast Newsletter!

10 Questions for Al Gore.

Free versions of recent episodes:

Schuyler- you seem to have a handle on this more than anyone else so far here. How is it do you think that all these other independant scientific organizations have come to the same conclusions (AGW). Like all the academies of science, the EPA, the Meteorological Society, NASA, and others across the globe?? Are they using "tainted data" or do they independantly go out and make their own measurements??

The reason is that they all use the same data sets. The CRU folks are in charge of the data, in charge of the programs that measure the data, and in charge of the peer review process. They have never shared this data with anyone but themselves.

The emails show clear intent to deceive and control by refusin FOIA requess and even deleting information to avoid releasing it. And an examination of the computer programs reveals shockingly shoddy programming. They have also lost data and reconstructed with 'synthetic' data, i.e.: Not real. My guess is more will be revealed as the data itself is examined.

The data for AGW is from reporting stations around the globe for the last few decades is real measured data, but it is often skewed because the stations are located in urban areas. The data past the 20th century has been out together using 'proxies,' which means ice cores, tree rings, and coral growth. We are supposed to believe that somehow these guys can measure temperature to within one tenth of a degree by studying the width of tree rings.

And do you hear it?? The creationists will be using this to say that science has undermined theology. Evolution cannot be true.

Nah. I don't think so. Evolution is backed up by 150 years of peer reviewed science. AGW isn't.
 
Here's an interesting interview with a climatologist who has had concerns about the CRU's behavior for some time.

<object width="560" height="340"><param name="movie" value="http://www.youtube.com/v/Ydo2Mwnwpac&hl=en_US&fs=1&"></param><param name="allowFullScreen" value="true"></param><param name="allowscriptaccess" value="always"></param><embed src="http://www.youtube.com/v/Ydo2Mwnwpac&hl=en_US&fs=1&" type="application/x-shockwave-flash" allowscriptaccess="always" allowfullscreen="true" width="560" height="340"></embed></object>
<input id="gwProxy" type="hidden"><!--Session data--><input onclick="jsCall();" id="jsProxy" type="hidden">
 
The climate folks have figured out what 'Hide the Decline' is all about:


There it is in red. In the IPCC report they deleted the red part.

Also, more fraud has turned up in New Zealand where the climate figures for the entire country have been altered to show higher temperatures. More on that later.
 
Here's an example of a weather reporting station in Tucson, AZ. they say it's getting hotter in Tucson. The guy who took this picture says when he was there a car pulled up by the station and left its motor running for several minutes, probably to keep his car's AC on. Wonder why Tucson is so hot?

tucson_from_above.jpg
 
There's a new (and entirely different) scandal in New Zealand. The published statistics show a graph like this:

NZ_NIWA.jpg


But if you take the raw data and graph it yourself, you get this:

NZ_RAW.jpg


And that's because they changed the actual data like this:

NZ_Trends.jpg


And thusly, Cap & Trade is invoked.....
 
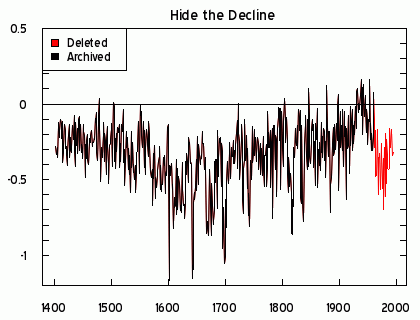
Here's an article from Bore Patch that discusses the problems with the computer code in the CRU models. There are only four data sets for temperature change in the world, and CRU basically controls two of them. When it is reported that the vast number of scientists confirm AGW, remember that they are a) quoting each other and b) using the same data sets. If these data sets are corrupt, how can their conclusions not be?

--begin:

The HARRY_READ_ME.txt file documents a multi-year effort by one of the CRU programming staff to figure out just how the climate model software worked. The only way to describe it is "hair raising" (at least to someone who is in the software industry).

If you want to look for smoking guns, you can find it here. It is thousands of lines long. If you were to look at the text starting on line 5434, you will find this:
Here, the expected 1990-2003 period is MISSING – so the correlations aren’t so hot! Yet
the WMO codes and station names /locations are identical (or close). What the hell is
supposed to happen here? Oh yeah – there is no ’supposed’, I can make it up. So I have :)

If an update station matches a ‘master’ station by WMO code, but the data is unpalatably
inconsistent, the operator is given three choices:

You have failed a match despite the WMO codes matching.
This must be resolved!! Please choose one:

1. Match them after all.
2. Leave the existing station alone, and discard the update.
3. Give existing station a false code, and make the update the new WMO station.

Enter 1,2 or 3:

You can’t imagine what this has cost me – to actually allow the operator to assign false
WMO codes!! But what else is there in such situations? Especially when dealing with a ‘Master’
database of dubious provenance (which, er, they all are and always will be).​
What can we glean from this? Several things, none of them good for the reputation of the "science" of Anthropogenic Global Warming:

1. The climate change data sets are - by CRU's own admission - are filled with decade-long gaps ("the expected 1990-2003 period is MISSING").

2. The climate data sets contain - by CRU's own admission - fabricated data ("I can make it up. So I have :)").

3. The the data is inconsistent to the point of confusion ("the WMO codes and station names /locations are identical") and so - by CRU's own admission - a manual override process was added to the code, allowing the person running the code to make arbitrary changes to the data (this bit:
Please choose one:

1. Match them after all.
2. Leave the existing station alone, and discard the update.
3. Give existing station a false code, and make the update the new WMO station.

Enter 1,2 or 3:)
4. (speculation here) These manual overrides are not logged anywhere, meaning that for any given output of the model, it is impossible to know what was manually changed during the run, or the impact of those changes on the output.

5. (speculation here) There is no method to save these changes, so that the next time the model is run it may (probably will?) produce different output.

I'm not sure quite what to call this process on display here, but "science" is not the appropriate word. What does "peer review" mean when likely nobody has reviewed the operator changes? I would go as far as to say that any published paper that relies on the output from this process should be assumed to be suspect until demonstrated otherwise.

Look, who are you going to believe, Al Gore or your lieing eyes?
6322916946732811685-6017872309010830377
 
Hre's another graph showing manipulation of climate data. The actual measured difference during these years was .1*C, i.e.: 1/10th of a degree. This graph shows the manual ADJUSTMENTS to the data without the raw data itself (Final minus Raw). In other words, the manual adjustments to the temperatures were up to 5.5 TIMES the actual measurement itself. The measured signal was .1. The noise is up to .6. All these scientists who conform AGW are using THIS kind of data to make conclusions. This graph is directly from NOAA itself.

ushcn_corrections.gif
 
Here's a famous graph from IPCC4 used by Al Gore in 'An inconvenient truth. It shows a near perfect correlation between CO2 concentrations and temperature. As you can see, it really is very, very close. Apply a statistical calculation to this and you'll get a very high number, probably on the order of 95-99. So obviously CO2 affects temperature, right? And if we get higher concentrations of CO2 in the atmosphere, it will warm up, right?

Picture1.jpg


No, not quite. What this graph ACTUALLY shows is that 800 YEARS AFTER it gets warmer, CO2 in the atmosphere goes up. In other words, higher temperatures CAUSE CO2 gas to be in higher concentrations. Al Gore got it backwards. How could that happen? As the climate gets warmer, CO2 is out-gassed from the oceans, increasing its concentration. As it gets cooler, CO2 is re-absorbed, so the concentration lessens.

Yet this graph right here has been used to 'prove' global warming.

Bzzt! Thanks for playing!
 
Take a look at this site, which is a reference to all the weather monitoring stations in the US. Scroll down a bit to see how placement of these monitors is influenced by their surroundings. Interesting that in the examples shown, those which are well sited show no temperature increase. Those that are sited near heat sources do. So how accurate does that make our reporting stations? It loos to me like the vast majority of them overstate the temperature: Home
 
I have not researched this topic or done any homework. Well it obvious for a layman like me, industrial pollution, releasing of toxic gases, does very little good for the Earth.It crazy to think the opposite would be the case. I Have seen the climate change over the last three years here in Ireland. Very little sun, not that we got more than two to three weeks of good sunshine during the summer.But in the last three years we be lucky to see one week of sunshine. It all rain and lately we have had some of the worst floods for centuries.

I am still not sure is this caused by the earth warming up or the earth cooling down.I wonder. Sun usually heats the earth and if we are getting less sun personally, does that mean the sun is becoming less powerful.I not very knowledge on the topic so pardon my ignorance if i am wrong.
 
A couple of points. There is no question that we need to stop pollution and stop trashing the planet. But this begs the question because hey are claiming CO2 is a pollutant.

The whole AGW thing is based on CO2. They are saying CO2 is a 'greenhouse gas' and that it is bad. But CO2 is different than other greenhouse gasses. If you want to eliminate CO2, stop breathing. It's that fundamental. To stop it means we can no longer 'combust' anything. It's across the board.

In past times, when the climate was warm and CO2 was 'higher' than it is now, the planet was lush with plants. If the planet were warmer, vast stretches of land in Canada and Siberia would be bread baskets to the world. AGW alarmists always pont to how many more people would die if it warmed up, but they never say how many people would live because it wasn't as cold.

The entire AGW thesis is based on 'positive feedback.' It's not that CO2 itself will cause harm, but that a higher CO2 level will trigger other bad stuff that will take us to a 'tipping point' and, well, kill everything, basically. There is no doubt that CO2 will 'warm the planet' slightly, perhaps about 1 degree Celsius in the next 100 years. But 'positive feedback' is not normal. negative feedback is. No one has proven that positive feedback will take place and that's the crux of the argument.

Anecdotal evidence doesn't count. Katrina was devastating because it hit an unprepared big city. Katrina wasn't 'caused by' Global warming. Hurricanes and tornadoes have DECREASED over the last decade to an all time low. Glaciers have been retreating since 1800, and not everywhere. If you say this is caused by Global Warming, then why did they decrease at the same exact rate from 1800 to 1900? To make this work you'd have to postulate that something else caused glaciers to retreat for 100 years, then suddenly that mechanism stopped completely and global warming took over an caused them to retreat for the next 100 years.

The data is clearly flawed. That's what Climategate is all about. Much of the historical record has been tampered with and we have the evidence in the emails and the computer programs themselves. When their own data showed a medieval warming period warmer than our own, they literally said, "We've got to get rid of the MWP" and they made it disappear. The 'hockey stick' graph has been proven to be erroneous because random numbers put into that program cause a hockey stick. When the last decade has proven colder, they often just neglected to add the last ten years onto the graphs.

Further, CRU erased the historical raw data so no one can go check it. The data they do have is a mess. In some cases they claimed global warming by taking tree-ring samples from a total of 12 (twelve) trees. When that area in Siberia was tested again with more trees, the warming spike just disappeared.

Here's a pretty good summary that goes into some other details: William M. Briggs, Statistician s Guide to Global Warming Evidence
 
CO2 has been as high as 7000 ppm in the past. today it is 387.75 ppm. at the beginning of the industrial age is was about 280 ppm. your average office cubicle is approx 4,000 ppm, submarines can reach 10,000 ppm. greenhouses are pumped up to 1200 ppm. you exhale approx 40,000 ppm. plants start to starve at 200 ppm.
doubling of CO2 levels will not double warming.
for some easy to understand pdf books explaining the scam check out: The Skeptics Handbook JoNova
 
Well for me, this has been an event that has really raised my skepticism of global warming. When the data is just not right there is a problem. I am overly disappointed to say the least in the science on this subject. How are we to know who we can trust to provide the correct data?? This is major letdown. I look at science as the method we use to find truth. But this seems to be a perversion of data, not truth. Don't get me wrong, I think a lot of scientists are innocent in this going on the provided "objective" data which leads them down a certain path.

So, .... why?? Why would they do this?? Who is connected to who?? Where does the money start and end?? How do we prevent something like this happening again?? It seems more than just missing/slanted/falsified data. Peer review is supposed to be the checks and balances, but this method is apparently flawed as well. People had better start making some noise about this because I, for one, want some answers. We deserve some answers.

Jesse Ventura was just on a radio show I listen to sometimes. He is doing a show on conspiracies including global warming. And he was asked about it. Basically he said he believed in global warming until he found that the solution to it (cap and trade) didn't solve the problem. It just penalized companies into spending more money, but didn't reduce co2 or even touch the so-called problem. That's when he began to be skeptical of it.
 
Here's another way of looking at CO2 concentrations. Ask the following question:

If the atmosphere was compared to an airplane flight from Los Angeles to New York, how far in your travel would you be to represent the percent of CO2 in the atmosphere itself, i.e.: What town would you be flying over?


Answer: Your airplane would still be on the runway at Los Angeles.
 
Well, just because co2 is a very small percentage of the atmosphere doesn't mean it isn't important or influential. Plants would die without that small percent. How much does it affect the heating or cooling effect of our planet?? I don't really know. I think climate change is affected by numerous gases, radiation, ocean currents, volcanism, clouds, water vapor, etc. What significant part each plays is really beyond me, .... . and probably science until we get real data for long periods of time.
 
Back
Top