And some interesting science and observed data behind it.
North Pacific Update: The Blob’s Strengthening Suggests It’s Not Ready to Depart | Watts Up With That?
This post provides an update of the unusual warming event in the sea surfaces of the eastern extratropical North Pacific…what is now regularly called “The Blob”. It does not appear to be ready to depart anytime soon. See the sea surface temperature anomaly map in Figure 1 for the location of The Blob.

Figure 1
For a reasonably easy-to-understand overview of The Blob and its companion the Ridiculously Resilient Ridge, and their impacts on North American weather, see the recent USAToday article
How ‘the blob’ caused USA’s weird weather. The article, of course, closes with a seemingly mandatory alarmist prophecy about future weather. Other than that, it’s well worth the read if this subject is new to you. There are links to a number of other posts and papers about The Blob at the end of this post.
In this post, we’ll look at the impacts of the North Pacific on global sea surface temperatures and global land+ocean surface temperatures. As I’ve stated before, the unusual warming of the North Pacific, which is linked to weather there, was the primary cause of the record high global surface temperatures reported by GISS, NCDC and the UKMO in 2014.
Lower troposphere data are next. The Blob appears in the lower troposphere temperature anomaly data, though it was stronger in 2013 than 2014.
We’ll present the sea surface temperature anomalies for a number of regions of the North Pacific, zooming in on the location of The Blob in the eastern extratropical portion. Sea surface temperature anomalies for The Blob are higher in the first 3 months of 2015 than they were in 2014.
Next is the depth-averaged temperature data for the North Pacific during the ARGO-era, including the depths of 0-700 and 0-2000 meters. The North Pacific to depth has cooled, not warmed, since 2005, even with The Blob.
Last, I’ve included an animation of the sea surface temperature anomalies for the North Pacific, which indicates The Blob originated in the western extratropical North Pacific and worked its way eastward.
As a reminder, let’s start with the absence of warming in the surface of the North Pacific for the 2+ decades, leading up to the formation of The Blob.
NORTH PACIFIC SEA SURFACES SHOWED NO WARMING (BASED ON THE LINEAR TREND) FOR ALMOST TWO AND A HALF DECADES
This portion of the post is for those new to the discussion of the North Pacific sea surface temperatures and The Blob.
Figure 2 shows the annual sea surface temperature anomalies for the period of 1989 to 2014. As you’ll note, the periods of 1989 to 2012 and 2012 to 2014 are shown in different colors. Based on the linear trend of 0.00 deg C/decade for the period of 1989 to 2012, the data for the surface of the entire North Pacific ocean shows no evidence of long-term warming for 24 years, almost 2 ½ decades. Then, in 2013 and 2014 there were weather-related upticks, which, laughably, alarmists claim were evidence of human-induced global warming.

Figure 2
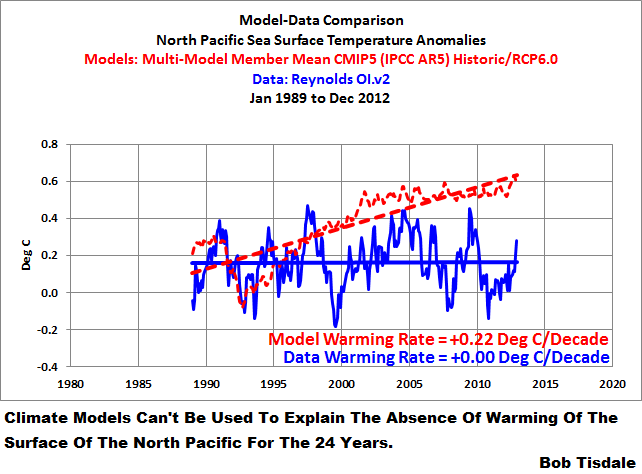
I’ve borrowed Figure 3 from the post
here. In addition to the sea surface temperature data for the North Pacific, it shows that the average of the outputs of the climate models used for the IPCC’s 5th Assessment Report, basically the consensus of the models. The models indicate the surface of the North Pacific should have warmed more than 0.5 deg C from 1989 to 2012…IF it was warmed by the manmade greenhouse gases that drive the climate models…but the surface there didn’t warm.

Figure 3
And as I noted in that post,
If the manmade greenhouse gas-forced climate models used by the IPCC cannot explain the 24-year absence of warming of the surface in the North Pacific, it can’t be claimed that the weather-related warming there in 2013 and 2014 were caused by manmade greenhouse gases. That little bit of common sense eludes alarmists.
For a more detailed look at how poorly climate models simulate the surfaces of the oceans during the satellite era, see the January 2015 post
Alarmists Bizarrely Claim “Just what AGW predicts” about the Record High Global Sea Surface Temperatures in 2014.
And for a discussion on the use of the model mean, see the post
here.
THE SIZEABLE WEATHER-RELATED UPTICK IN NORTH PACIFIC SEA SURFACE TEMPERATURES WAS THE PRIMARY CAUSE OF THE REPORTED RECORD-HIGH GLOBAL SURFACE TEMPERATURES IN 2014
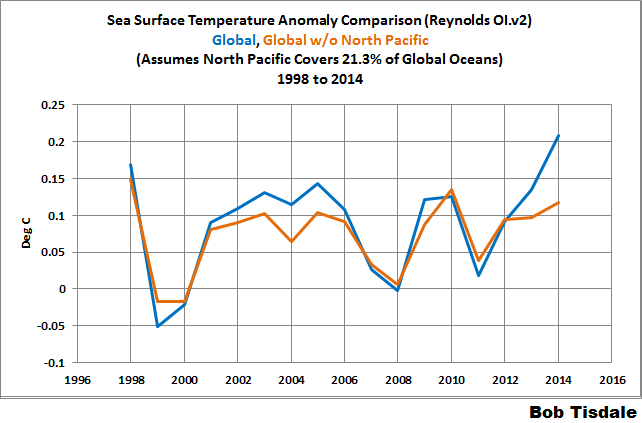
We discussed in a number of posts over the past year how the weather events in the North Pacific—The Blob and the impacts of the developing El Niño—were responsible for the record high global sea surface temperatures in 2014. We can once again show this by comparing the observed global sea surface temperature anomalies to the global data with the North Pacific removed. See Figure 4. In it, we used the coordinates of 0-65N, 100E-90W for the North Pacific data and assumed that the North Pacific covered 21.3% of the surface of the global oceans. (Refer to the NOAA webpage
here.) Without the impacts of the two weather-related events in the North Pacific in 2014 (The Blob and the El Niño), the record-high year for global sea surface temperatures would still be 1998.

Figure 4
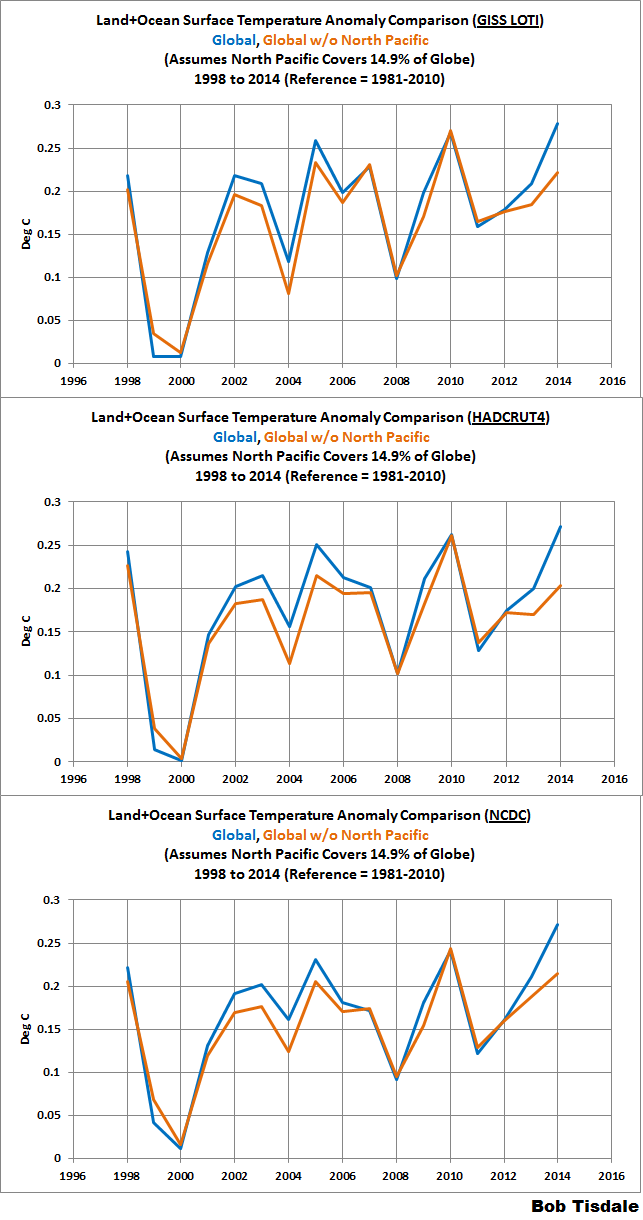
And for those interested, we can perform the same simple analysis with the global land+ocean surface temperature products from GISS, NCDC and UKMO. I’ve used their respective sea surface temperature datasets (ERSST.v3b for GISS and NCDC and HADSST3 for the UKMO HADCRUT4 data), the coordinates of 0-65N, 100E-90W for the North Pacific, and assumed the North Pacific covers 14.9% of the globe. The results for the three surface temperature products are shown in Figure 5.

Figure 5
Without The Blob and the El Niño events in the North Pacific in 2014, 2010 would still be the warmest year…and that was a result of the aftereffects of the 2009/2010 El Niño.
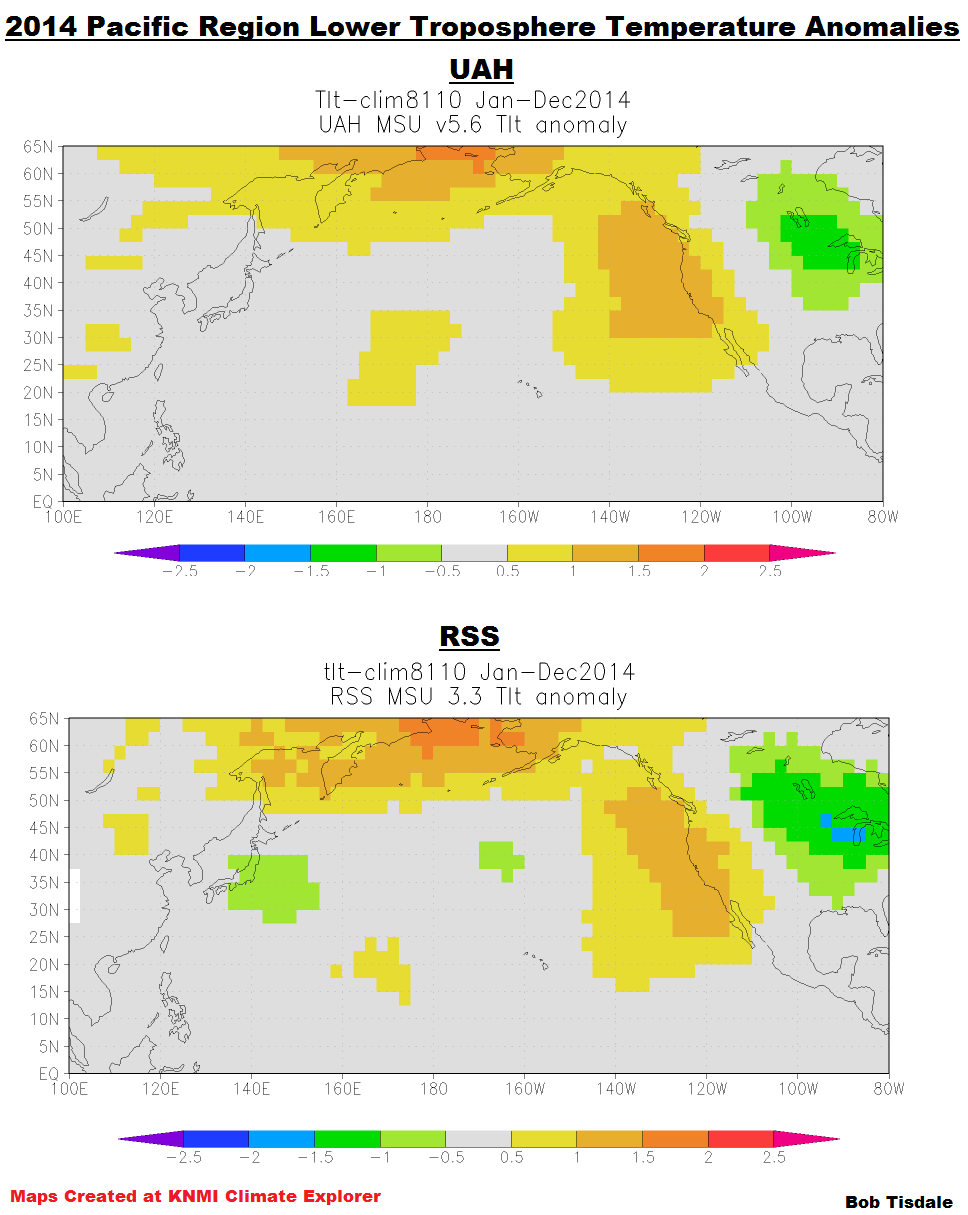
DOES THE BLOB SHOW UP IN THE LOWER TROPOSPHERE TEMPERATURE DATA?
We only need to look at lower troposphere temperature anomaly maps of the North Pacific region for the year 2014 to answer that question. Refer to Figure 6. Both RSS and UAH lower troposphere temperature anomalies are displayed.

Figure 6
Figure 7 compares the sea surface temperature anomalies for The Blob region (35N-55N, 150W-125W) to the lower troposphere temperature anomalies. All show sizeable upticks in 2013, with the lower troposphere data rising faster. Then, in 2014, the lower troposphere data show a slight cooling while the sea surface temperature data continue to rise. But that divergence is not unusual for two different metrics in such a small part of the globe. As shown, the sea surface temperature data and the lower troposphere data are often out of synch there.

Figure 7
REGIONAL SEA SURFACE TEMPERATURE DATA FOR THE NORTH PACIFIC
For each of the following portions of the North Pacific, I’ve provided two graphs. The top cells are time-series graphs for the full term of the monthly Reynolds OI.v2 sea surface temperature data, November 1981 to March 2015. Before the upswings in 2013 and 2014, all regions show multidecadal periods of little-to-no warming based on the linear trends. I’ve shown those periods in blue for each region, along with the linear trend line, to reinforce that point.
The bottom graphs compare the evolutions of the sea surface temperature anomalies for the years 2012, 2013, 2014 and year-to-date 2015.
North Pacific – Figure 8 presents the monthly sea surface temperature anomalies for the North Pacific from the equator to the Bering Strait (0-65N, 100E-90W). See map
here. It’s quite obvious that the monthly and yearly sea surface temperatures of the North Pacific are quite volatile, and that can be said for all of the smaller subsets that follow. But as noted earlier, the data showed no long-term warming from 1989 to 2012. Then, quite surprisingly, sea surface temperatures there took a sizeable upswing in 2013 and 2014. The upswings, of course, were caused by The Blob and the evolution of the 2014/15 El Niño.

Figure 8
The surface temperature anomaly data for the North Pacific show large seasonal components in 2013 and 2014, with the anomalies peaking in August in 2013 and in August and September in 2014. Sea surfaces in the North Pacific warmed noticeably in 2013 and 2014.
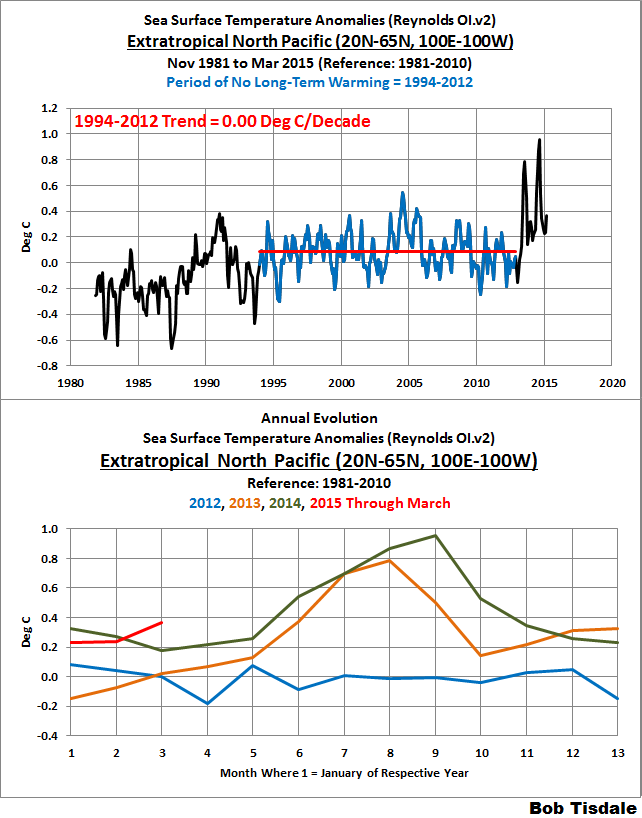
Extratropical North Pacific – For this portion, we’re using the coordinates of 20N-65N, 100E-100W. Think of the North Pacific north of the big island of Hawaii to the Bering Strait. See the map
here. The sea surfaces of the extratropical North Pacific, Figure 9, also show an extended period with little long-term warming before the upswing in 2013 and 2014. Here, the period without warming lasts from 1994 to 2012, almost 2 decades. The temporary dip and rebound from 1991 to 1993, likely caused by the effects of the eruption of Mount Pinatubo, impose a slight warming trend on this region if we try to extend the period back to 1990.

Figure 9
The seasonal components for the extratropical North Pacific sea surface temperature data during 2013 and 2014 are also very strong. This year, the sea surface temperatures are comparable to 2014, though they are evolving differently.
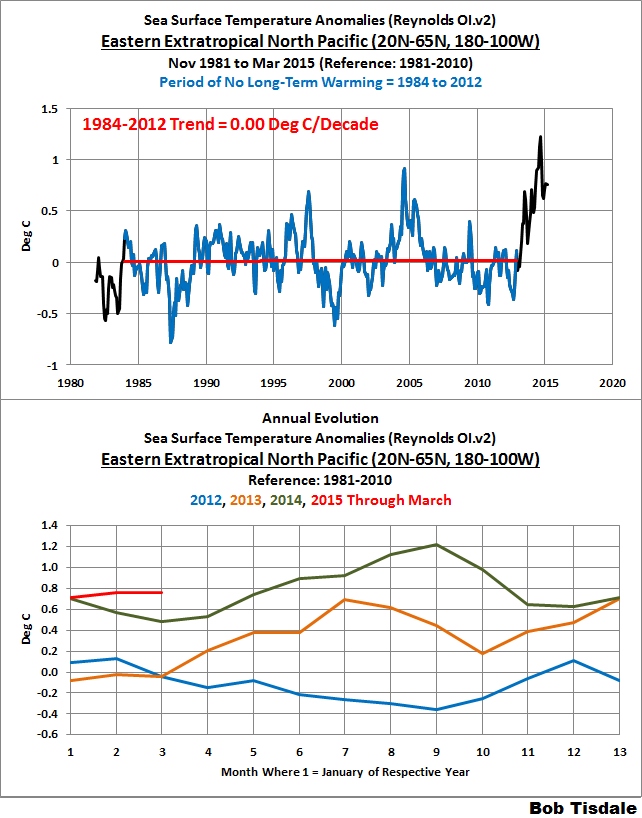
Eastern Extratropical North Pacific – Closing in on The Blob, Figure 10 presents the sea surface temperature anomalies for the eastern extratropical North Pacific (20N-65N, 180-100). See the map
here. So we’re looking at the portion of the North Pacific that’s north of the big island of Hawaii and east of the dateline. There, looking backwards before the upswing in 2013, there is no long-term warming (based on a linear trend) from 1984 to 2012, even with the temporary warming event of 2004/05.

Figure 10
The sea surface warming in the eastern extratropical North Pacific occurred primarily in 2013. There was a seasonal warming in 2014, but 2014 and 2015 are starting at basically the same value. Sea surfaces there in March 2015, however, are about 0.3 deg C warmer than in March 2014.
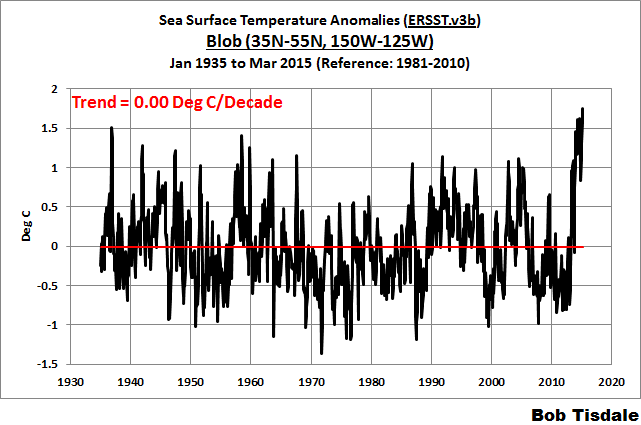
The Blob – For Figure 11, I’ve used the coordinates of 35N-55N, 150W-125W for The Blob. See the map
here for the location. While quite volatile, the sea surface temperatures of this region showed no warming (based on the linear trend) from the start of the Reynolds OI.v2 data to 2012. That’s 3 decades of no surface warming in that region before the upticks in 2013 and 2014.

Figure 11
The Blob definitely evolved in 2013. In fact, compared to 2013, the sea surface temperature anomalies of the blog remained relatively flat in 2014. Sea surface temperatures of The Blob are rising early in 2015 and are presently well above the levels seen in 2014.
And just in case you’re wondering, The Blob region shows no long-term warming for 80 years, according to NOAA extended reconstructed sea surface temperature dataset ERSST.v3b. See Figure 12. Unlike the other graphs in this section, I’ve included the years 2013, 2014 and year-to-date 2015 in that trend analysis.

Figure 12
California-Mexico Coastal Waters – The surface temperatures of the waters off the coasts of California and Mexico also made a recent upswing, but there it happened in 2014. Refer to Figure 13. For this region, we’re using the coordinates of 15N-40N, 125W-100W. See the map
here. Prior to 2014, the sea surfaces there cooled since the start of the Reynolds OI.v2 data. In fact, the California-Mexico coastal waters still show no long-term warming, even if we include the 2014 and 2015 data. See the graph
here.

Figure 13
The surface warming of the California-Mexico coastal waters began late in 2013, which is well before the strong Kelvin wave, which initiated the 2014/15 El Niño, reached the coasts of the Americas. As you will see, however, in an animation that follows, the California-Mexico coastal waters warmed from the south northward, which suggests that the warming there was also not caused by the warm waters of The Blob migrating southward.
There was a recent study of the sea surface temperatures in that region. See Yuan and Yamagata (2014)
California Niño/Niña. The California Niño/Niña is said to be independent of the El Niño/La Niña events in the tropical Pacific. That California Niño/Niña phenomenon, however, occurs in July-August-September, which doesn’t align with the warming there in 2014.
ARGO-ERA NODC DEPTH-AVERAGED TEMPERATURE ANOMALY DATA SHOWS THE NORTH PACIFIC COOLING TO DEPTHS OF 700 METERS AND 2000 METERS SINCE 2005
Figure 14 presents the NODC’s annual depth-averaged temperature data for the North Pacific (0-65N, 100E-90W) for the depths of 0-700 meters and 0-2000 meters. Note that the NODC depth-averaged temperature data for the depths of 0-2000 meters begins in 2005 at the KNMI Climate Explorer, limiting the data to the ARGO era, so I’ve also only illustrated the 0-700 meters data for that time period. Both show noticeable negative trends over the past decade.

Figure 14
The Blob does appear in the depth-averaged temperature data to those two depths. See Figure 15, which uses the coordinates of 35N-55N, 150W-125W for The Blob. At both depths, the upticks in 2014 were greater than those of 2013.

Figure 15
HOW DEEP DOES THE BLOB GO?
Figure 16 is a cross section of the subsurface temperature anomalies of the Eastern Pacific Ocean available from the
ECMWF webpage
here. It presents the output of their ORAS4 reanalysis. Keep in mind, a reanalysis is the output of a computer model that uses data as inputs. But with all of the ARGO floats bobbing around in the oceans, and assuming the ARGO data are used in this reanalysis, this should be a reasonable representation.

Figure 16
The cross section is for the month of March 2015 and, in the top portion, it presents the average subsurface temperature anomalies to depths of 500 meters. The x-axis (horizontal axis) stretches from 50S on the left to 50N on the right. The longitudes are 160W-90W. Basically, if we were to take a slice of the Pacific Ocean that was bordered by the coordinates of 50S-50N, 160W-90W and look from east to west, those are the average temperature anomalies at depth. The Blob is visible to the right, and appears as the elevated subsurface temperature anomalies. So The Blob is not simply a surface phenomenon. But we would expect that with wind-driven ocean mixing.
I’ve also highlighted the most Kelvin wave, which is making its way from west to east along the equator. Much of that pocket of warm water will rise to the surface over the upcoming months and likely strengthen the current El Niño.
NORTH PACIFIC SEA SURFACE TEMPERATURE ANOMALY ANIMATION
I’ve provided Animation 1 to confirm that the elevated sea surface temperatures originally formed, as one would expect, in the west-central North Pacific during the back-to-back La Niñas of 2010/11 and 2011/12. What came next was unexpected. Those elevated sea surface temperatures then migrated eastward to create The Blob.
Animations of maps of monthly sea surface temperature anomalies can be quite volatile, with weather effects and seasonal components creating a lot of visual noise. To minimize the monthly volatility, each of the following maps presents the average sea surface temperature anomalies for a full year. The annual maps then advance on a monthly basis. That is, the first map covers the 12-month period of January 2010 to December 2010. The second map is for February 2010 to January 2011. The third map: March 2010 to February 2011. And so on through the last map for April 2014 to March 2015. This is similar to smoothing time-series data with a 12-month running-mean filter.

Animation 1
You’ll also note the evolution of the 2014/15 El Niño later in the animation. It appears to enhance The Blob and cause the sea surface temperatures to rise along the west coast of North America.
FURTHER READING
We’ve been discussing the unusual warming event in the North Pacific since it first made its presence known in the July 2013 sea surface temperature data. For additional information, see the posts:
Also see Anthony Watts’s April 2015 post
“Warm blob” in Pacific Ocean not caused by climate change, affects U.S. weather at WattsUpWithThat. It includes the press release for two papers: Bond et al. (2015)
Causes and Impacts of the 2014 Warm Anomaly in the NE Pacific and Hartmann (2015)
Pacific sea surface temperature and the winter of 2014.
CLOSING
The Blob is a naturally occurring weather event. Along with another natural event, the El Niño of 2014/15, The Blob caused the reportedly record-high global surface temperatures in 2014. The Blob is coupled with an atmospheric phenomenon known as the Ridiculously Resilient Ridge. The Blob and the Ridiculously Resilient Ridge have enhanced the drought in California and are responsible for the reported high surface temperatures there as well. Likewise, they are also said to be major contributors to cold weather and snow in the eastern U.S.
The sea surfaces of the North Pacific hadn’t warmed for nearly 2.5 decades and then warmed unexpectedly in 2013 and 2014. The sea surfaces of The Blob region according to NOAA’s long-term data show no warming for 8 decades. Regardless of that reality, alarmists nonsensically attribute The Blob to the emissions of manmade greenhouse gases.
The Blob is not only a sea surface temperature phenomenon. It appears in the Lower Troposphere Temperature data and in the NODC’s depth-averaged temperature data for the depths of 0-700 meters and 0-2000 meters. Of course, the NODC depth-averaged temperature data for the North Pacific show no warming during the ARGO era.
There are a number of questions now, including:
- How long will The Blob and the Ridiculously Resilient Ridge last?
- Assuming a La Niña follows this El Niño, will the La Niña be strong enough to overcome The Blob and the Ridiculously Resilient Ridge?
- What will be the combined effects of the strengthening El Niño, The Blob and the Ridiculously Resilient Ridge on weather worldwide over the next 12 months?
- Will the El Niño be strong enough to overcome the other two and bring rain to California, or will The Blob and the Ridiculously Resilient Ridge continue their influences there?
- Will The Blob have a long-term impact on the sea surface temperatures of the Eastern Pacific Ocean as a whole? That is, will The Blob be responsible for another upward shift in the sea surface temperatures of the East Pacific Ocean like that in 1976/77?
I’m sure you can think of others.
SOURCE
The data and maps presented in the post are available through the
KNMI Climate Explorer.